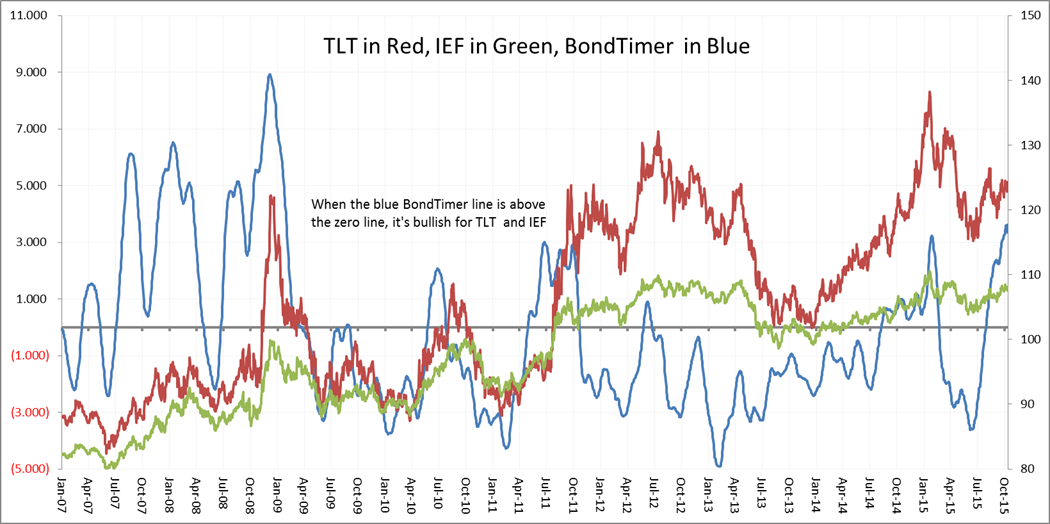
Based on activity in the corporate bond market, our new BondTimer program is a 100% mechanical timing indicator that has applied well to trading TLT (20yr Bond ETF) and IEF (7-10yr Bond ETF). Model can be long, short or neutral depending on the level of the BondTimer indicator. Indicator level and model position updated daily for subscribers. Historical indicator data also available upon request.
Note that charts and track records only represent a sample. They are NOT up-to-date. Only subscribers have access to up-to-date changes.
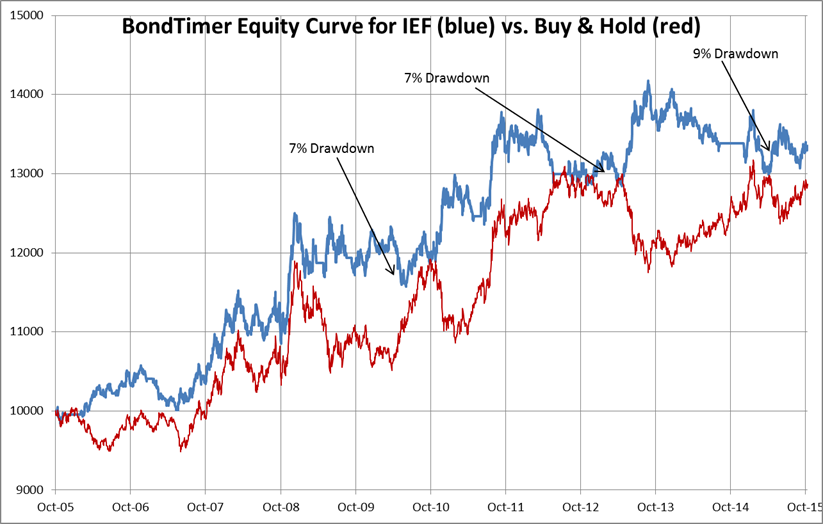
BondTimer Signals Using IEF
10/12/2005	Buy	83.62	  -0.43%   $99,569
11/18/2005	Exit	83.26
2/9/2006	Sell	82.86	   2.68%   $102,237
7/14/2006	Exit	80.64
7/28/2006	Buy	81.22	   1.80%   $104,074
1/3/2007	Exit	82.68
1/29/2007	Sell	81.73	  -2.39%   $101,591
3/21/2007	Exit	83.68
3/30/2007	Buy	83.09	  -1.43%   $100,136
5/23/2007	Exit	81.9
5/31/2007	Sell	81.8	   1.16%   $101,299
7/16/2007	Exit	80.85
7/23/2007	Buy	81.33	   8.64%   $110,055
5/7/2008	Exit	88.36
5/19/2008	Sell	88.65	   1.06%   $111,222
7/3/2008	Exit	87.71
7/9/2008	Buy	88.76	   6.83%   $118,816
4/3/2009	Exit	94.82
5/7/2009	Sell	92.42      0.91%   $119,896
9/1/2009	Exit	91.58
9/22/2009	Sell	91.36	  -2.43%   $116,983
6/4/2010	Exit	93.58
6/11/2010	Buy	93.4	   3.73%   $121,341
8/6/2010	Exit	96.88
8/19/2010	Sell	98.62	   3.78%   $125,931
5/10/2011	Exit	94.89
6/14/2011	Buy	96.21	   8.66%   $136,834
11/1/2011	Exit	104.54
11/7/2011	Sell	104.23   -3.92%    $131,465
6/5/2012	Exit	108.32
8/13/2012	Sell	107.92    3.47%	   $136,033
8/20/2014	Exit	104.17
12/16/2014	Buy	107.16   -0.60%	   $135,220
3/4/2015	Exit	106.52
3/10/2015	Sell	106.43   -0.24%	   $134,890
8/11/2015	Exit	106.69
8/20/2015	Buy	107.22
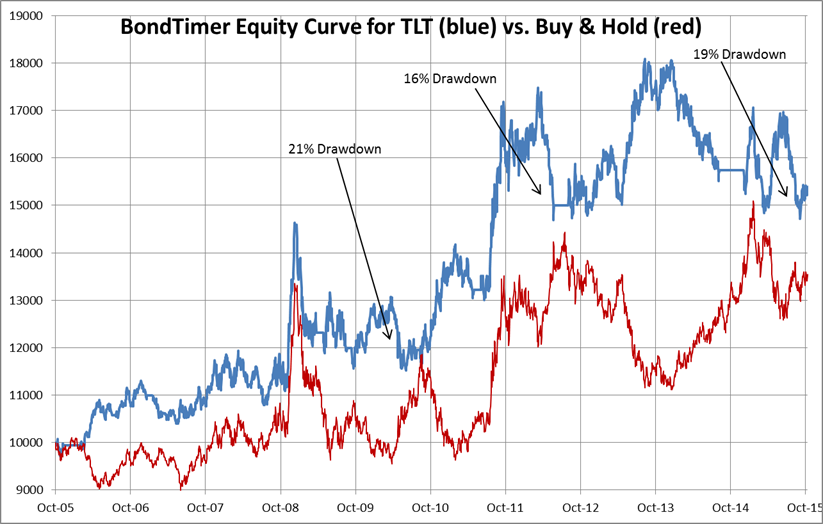
BondTimer Signals Using TLT
10/12/2005	Buy	90.7	-0.62%	$99,383
11/18/2005	Exit	90.14
2/9/2006	Sell	90.8	6.34%	$105,687
7/14/2006	Exit	85.04
7/28/2006	Buy	85.7	3.92%	$109,831
1/3/2007	Exit	89.06
1/29/2007	Sell	86.72	-3.49%	$105,993
3/21/2007	Exit	89.75
3/30/2007	Buy	88.28	-2.03%	$103,844
5/23/2007	Exit	86.49
5/31/2007	Sell	86.38	1.52%	$105,419
7/16/2007	Exit	85.07
7/23/2007	Buy	85.82	6.43%	$112,199i
5/7/2008	Exit	91.34
5/19/2008	Sell	91.96	-0.12%	$112,065
7/3/2008	Exit	92.07
7/9/2008	Buy	93.5	10.07%	$123,356
4/3/2009	Exit	102.92
5/7/2009	Sell	94.71	-1.43%	$121,597
9/1/2009	Exit	96.06
9/22/2009	Sell	96.18	-1.67%	$119,562
6/4/2010	Exit	97.79
6/11/2010	Buy	97.41	2.76%	$122,864
8/6/2010	Exit	100.1
8/19/2010	Sell	106.16	11.18%	$136,601
5/10/2011	Exit	94.29
6/14/2011	Buy	95.19	25.49%	$171,415
11/1/2011	Exit	119.45
11/7/2011	Sell	117.22	-8.86%	$156,236
6/5/2012	Exit	127.6
8/13/2012	Sell	125.49	7.57%	$168,064
8/20/2014	Exit	115.99
12/16/2014	Buy	127.6	-0.90%	$166,549
3/4/2015	Exit	126.45
3/10/2015	Sell	126.28	1.21%   $168,567
8/11/2015       Exit    124.75
8/20/2015       Buy     126.02
Copyright 2015 Astrikos LLC - Redistribution in whole or in part is prohibited - All Rights Reserved